Difference between revisions of "Prop Test - Four 9x6 Props"
(Created page with "Motors<br> <i>December 2012</i><br><br> This prop comparison is set-up for a fixed wing application (My Penguin). More specifica...") |
|||
| Line 1: | Line 1: | ||
| − | [[File:BTI.png|link=Power_Systems_&_Testing| | + | [[File:BTI.png|link=Power_Systems_&_Testing|Testing]]<br> |
| − | <i>December 2012</i><br><br> | + | <i>December 2012</i><br> |
| + | <br> | ||
| + | {| cellspacing="1" cellpadding="1" width="95%" border="0" | ||
| + | |- | ||
| + | | align="left" valign="bottom" width="30%" | __TOC__ | ||
| + | | align="right" width="70%" | [[File:Prop dwg.jpg|700px]] | ||
| + | |- | ||
| + | | | ||
| + | | align="right" width="50%" | Props! | ||
| + | |}<br> | ||
| + | |||
| + | == About this test == | ||
This prop comparison is set-up for a fixed wing application (My Penguin). More specifically, an FPV, ~65" pusher, powered glider, foamy application. The props selected were already in my inventory with the exception of the Graupner folder which was added by D-man (RCG). | This prop comparison is set-up for a fixed wing application (My Penguin). More specifically, an FPV, ~65" pusher, powered glider, foamy application. The props selected were already in my inventory with the exception of the Graupner folder which was added by D-man (RCG). | ||
Latest revision as of 22:35, 19 May 2016
Contents |

|
| Props! |
About this test
This prop comparison is set-up for a fixed wing application (My Penguin). More specifically, an FPV, ~65" pusher, powered glider, foamy application. The props selected were already in my inventory with the exception of the Graupner folder which was added by D-man (RCG).
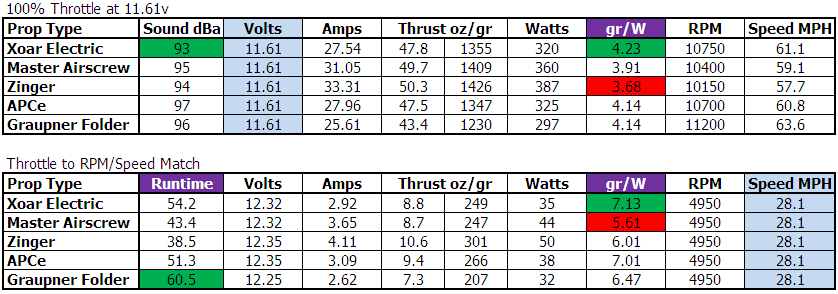
The charts below represent static performance which does not take in to account prop unloading in flight or the fact this type of aircraft doesn't see a lot of 100% throttle. They also do not take into account airframe drag. What they do show are the efficiency differences and there are no real surprises in this test. The numbers highlighted in green are the best and red the worst.
On the top chart all tests are normalized on the supply voltage. This is done by running each test at wide open throttle until the test voltage (11.61v) is reached. This gives a good view of the differences in propellor performance. The column, "gr/W", is a simple efficiency measure of thrust in grams per watt.
The bottom chart was normalized on RPM and prop speed. This shows how each prop performs relative to keeping a constant slow speed. Again, this doesn't take drag into account. The first column, runtime, is the theoretical maximum time a 3300mAh pack would last at the listed current, starting at maximum charge and ending at 80% discharge.
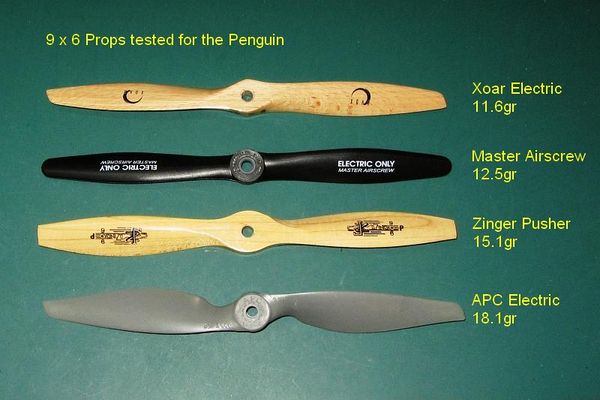
I want to get the most efficient power system and this usually means a high quality prop. With that I threw the listed props on the Bench Tester with a 3S pack and an SK3630-1400 motor (equivalent to a 2815-1400) to see what they would do. The props I selected for this are fairly well known:

|
| The test participants (without the folder) |
Here are the test results:
